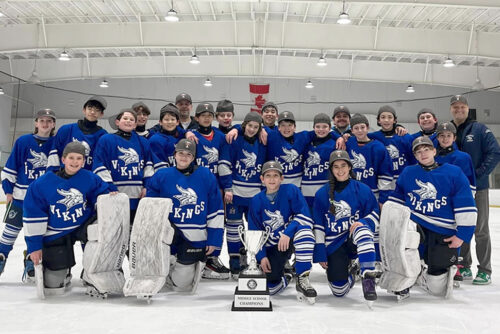
Port Washington News Glen Cove/Oyster Bay Record Pilot Syosset-Jericho Tribune Great Neck Record The Roslyn News Manhasset Press The Nassau Observer Nassau Illustrated News Menu Port Washington News Glen Cove/Oyster Bay Record Pilot Syosset-Jericho Tribune Great Neck Record The Roslyn News Manhasset Press The Nassau Observer Nassau Illustrated News Proudly Delivering Your Local News Search Search TOP STORIES Getting Started Fishing Amanda Olsen April 19, 2024 Double Emergence: Cicadas Taking Over Midwest Amanda Olsen April 12, 2024 Sloth Saga Enters New Phase Cole McDonnell April 5, 2024 FEATURES Electric Grid Improvements Coming To Nassau County Anton Media Group Staff April 26, 2024 More Than 50 Animals Rescued From Commercial Breeding Anton Media Group Staff April 26, 2024 Officials Unite Against State Housing Plan Amanda Olsen April 23, 2024 Children’s Service Providers Get Crucial Pay Bump Anton Media Group Staff April 23, 2024 COLUMNS Attacking Our Courts Undermines America Jerry Kremer April 22, 2024 Can The MTA Manage $15 Billion Carryover Capital Projects With The Next $51 Billion Or More Larry Penner April 15, 2024 Shine A Light For Charity On The INN Kayla Donnenfeld April 15, 2024 The Big Move Marisa Cohen April 15, 2024 LOCAL EDITIONS PORT WASHINGTON NEWS PORT WASHINGTON NEWS Going Plastic-Free To Promote Sustainability Julie Prisco April 22, 2024 MANHASSET PRESS MANHASSET PRESS The Vikings Hockey Team Wins The Middle School Championship Cole McDonnell April 22, 2024 THE ROSLYN NEWS THE ROSLYN NEWS Roslyn Athletes Taken Too Soon Lauren Feldman April 12, 2024 SYOSSET-JERICHO TRIBUNE SYOSSET-JERICHO TRIBUNE Former GEICO Building In Woodbury To Become Worship Facility Amanda Olsen April 22, 2024 GLEN COVE/OYSTER BAY RECORD PILOT GLEN COVE/OYSTER BAY RECORD PILOT Go Team EVA Cole McDonnell April 22, 2024 GREAT NECK RECORD GREAT NECK RECORD Great Neck Fourth-Grader Wins Top Trophy At International Jewish Knowledge Championship Julie Prisco April 19, 2024 NASSAU ILLUSTRATED NEWS NASSAU ILLUSTRATED NEWS Judge Tosses Blakeman’s Attempt To Block Attorney General’s Order Janet Burns April 24, 2024 THE NASSAU OBSERVER THE NASSAU OBSERVER Plainview Seeking Volunteer Firefighters Lauren Feldman April 19, 2024 Search Search TRENDING Our Arts & Entertainment Page Harmonious Maestro John Bayless strikes the perfect chord in musical mastery By Christy Hinko • April 26, 2024 Subscribe Now THIS WEEK'S SPECIAL SECTIONS
Can The MTA Manage $15 Billion Carryover Capital Projects With The Next $51 Billion Or More Larry Penner April 15, 2024